Adaptability is a critical characteristic of software systems that developers and architects constantly strive to achieve. However, it’s a delicate balance between productivity, performance, maintainability, and many other “ilities” that sometimes force trade-offs. One way to enhance a system’s adaptability is to start with the right level of operational abstraction. For this comprehensive guide, I’m making the strategic choice to start with Kubernetes, more specifically AWS Elastic Kubernetes Service (EKS).
This is an excellent foundation for adaptability as you can leverage numerous open source and commercial-grade packages. But what if you wanted to take microservices architecture a step further? There’s an architectural pattern called ports and adapters (also described as hexagonal architecture). Enter Dapr - a revolutionary way to build extensible and adaptable microservice systems ready for the modern cloud to tackle the next evolution of distributed computing.
In this ultimate guide, you’ll master distributed tracing with OpenTelemetry, implement production-ready Dapr microservices on Kubernetes, and achieve comprehensive observability with Datadog. Let’s dive deep into building resilient, traceable microservices!
- Solution Architecture
- Complete Implementation Walkthrough
- Building the Production-Ready EKS Cluster
- Implementing Enterprise Observability with Datadog
- Implementing Dapr for Distributed Microservices
- Building Production Microservices with NestJS and Dapr
- Load Testing and Distributed Tracing Validation
- Comprehensive Observability: Dapr Dashboard and Datadog APM Analysis
- Expert Insights and Advanced Microservices Patterns
- Key Takeaways: Mastering Modern Microservices Architecture
Solution Architecture
Before exploring the distributed microservices architecture, here’s the link to the GitHub repository so that you can clone and follow along with this hands-on tutorial.
This guide builds upon foundational concepts from my previous articles on Establishing Datadog on Kubernetes with EKS and 4 Benefits to using a Service Mesh. Now let’s dive into the complete solution architecture!
Kubernetes is undoubtedly a vast ecosystem with countless topics to learn, explore, and ultimately master. However, microservices deployment on Kubernetes doesn’t have to be complex when starting out. Essentially what you need is a VPC, a network with some subnets, and a nodepool (which defines the EC2 image to run). With those foundational components in place, I can deploy my 2-microservice solution with Dapr distributed tracing and Datadog observability that delivers enterprise-grade monitoring capabilities.
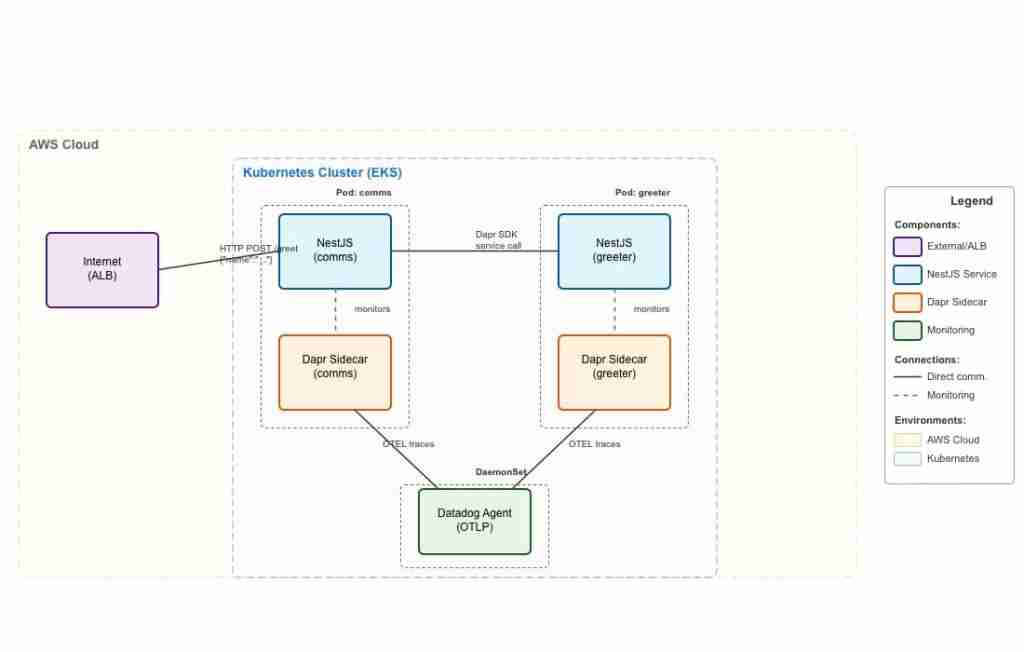
Complete Dapr microservices architecture showing distributed tracing flow from NestJS services through OpenTelemetry to Datadog
I’m deploying 2 microservices that have their own Pod definitions. These services will be annotated so that the Dapr sidecar is launched next to my service container and will intercept all traffic inbound and outbound. What Dapr also provides is a comprehensive set of APIs for communicating with external systems like queues, databases, and more - topics I’ll explore in future articles.
The key focus of this guide is demonstrating how Dapr generates OpenTelemetry traces automatically, connects them together across service boundaries, and ships them to your preferred observability platform. In this implementation, the Datadog Agent handles trace collection and forwarding, providing enterprise-grade distributed tracing capabilities.
This approach aligns with CNCF’s OpenTelemetry standards and leverages W3C Trace Context for seamless trace propagation across your microservices architecture.
Complete Implementation Walkthrough
This comprehensive walkthrough covers every aspect of building production-ready microservices with Dapr on Kubernetes. I’ll guide you through the complete setup process, from EKS cluster configuration to distributed tracing implementation, while showcasing real-world examples from both the Dapr Dashboard and Datadog APM.
Building the Production-Ready EKS Cluster
For creating our Kubernetes cluster, I’ll leverage the AWS eksctl command line tool. This provides comprehensive EKS management capabilities from the CLI while enabling infrastructure-as-code practices through YAML configuration files.
This approach follows AWS EKS best practices for cluster management and integrates seamlessly with other Kubernetes tools in your DevOps pipeline.
The configuration below launches a production-ready EKS cluster in us-west-2 named “dapr-demo”, utilizing AWS Graviton (ARM) nodes with m6g.large EC2 instances. This setup provides excellent price-performance optimization for containerized microservices. While EKS configurations can become significantly more complex for enterprise deployments, this foundation is perfect for learning Dapr microservices patterns and distributed tracing implementation.
---
apiVersion: eksctl.io/v1alpha5
kind: ClusterConfig

metadata:
  name: dapr-demo
  region: us-west-2

managedNodeGroups:
  - name: mng-arm
    instanceType: m6g.large
    desiredCapacity: 2
I’ll initiate the EKS cluster deployment by running: eksctl create cluster -f kubernetes/cluster-config.yaml. This command orchestrates the creation of multiple CloudFormation stacks for both the cluster control plane and managed node group. Upon completion, you’ll have a fully functional Kubernetes cluster ready for Dapr microservices deployment.
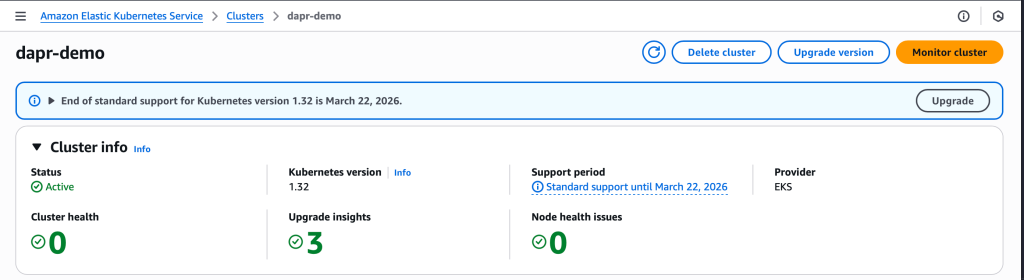
EKS cluster dashboard showing successful deployment with Graviton ARM nodes optimized for containerized workloads
Before proceeding to the Datadog observability setup, I need to install the EBS CSI Driver AddOn for persistent storage management. This is crucial for Dapr’s scheduler component which requires persistent volumes for state management in distributed microservices architectures.
eksctl create addon --cluster dapr-demo --name aws-ebs-csi-driver --region us-west-2Implementing Enterprise Observability with Datadog
I’ve previously covered Datadog and Kubernetes integration in detail in my article Establishing Datadog on Kubernetes with EKS, which explores cluster metrics, setup procedures, and the various observability dimensions Datadog provides.
For this distributed tracing implementation, I’ll demonstrate configuring the Datadog Agent to seamlessly collect OpenTelemetry traces from our Dapr microservices. This setup enables comprehensive application performance monitoring (APM) and distributed tracing visualization.
I’ll use Helm to install the Datadog Operator, following Datadog’s official Kubernetes deployment guide. This involves adding the Datadog Helm repository, creating the appropriate namespace, and configuring API key authentication for secure agent deployment.
# Install Datadog operator
helm repo add datadog https://helm.datadoghq.com
helm repo update
kubectl create namespace datadog-operator
helm install datadog-operator datadog/datadog-operator -n datadog-operator

# Create Datadog secret from environment variable and apply agent
export DATADOG_API_KEY='your-datadog-api-key-here'
kubectl create secret generic datadog-secret
    --from-literal=api-key="$DATADOG_API_KEY"
    -n datadog-operator
    --dry-run=client -o yaml | kubectl apply -f -
kubectl apply -f kubernetes/datadog/datadog-agent.yaml
Within moments of deployment, the EKS cluster appears in the Datadog Infrastructure Monitoring dashboard, providing immediate visibility into cluster health, resource utilization, and node performance metrics.
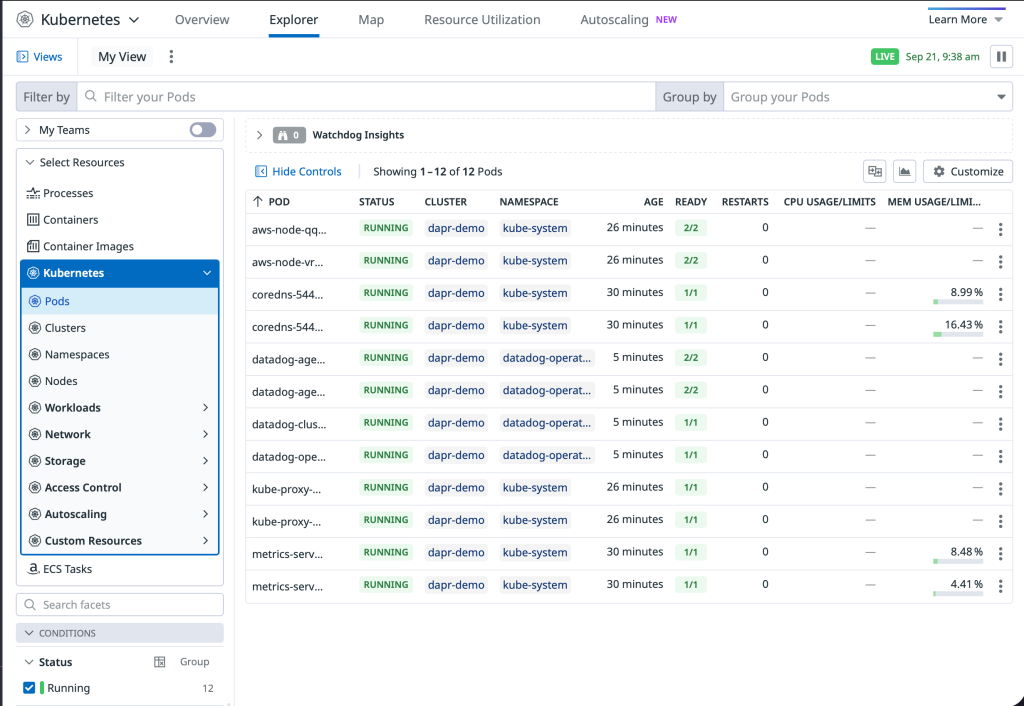
Datadog Infrastructure dashboard displaying real-time EKS cluster monitoring with node health, resource usage, and performance metrics
With enterprise observability now established, let’s proceed to implement Dapr for building resilient, observable microservices with automatic distributed tracing capabilities.
Implementing Dapr for Distributed Microservices
Before demonstrating the Dapr installation and configuration process, let me define this powerful platform using the official description from the Dapr project:
Dapr is a set of integrated APIs with built-in best practices and patterns to build distributed applications. Dapr increases your developer productivity by 30% with out-of-the-box features such as workflow, agentic AI, pub/sub, state management, secret stores, external configuration, bindings, actors, jobs, distributed lock, and cryptography. You benefit from the built-in security, reliability, and observability capabilities, so you don’t need to write boilerplate code to achieve production-ready applications. - Dapr Documentation
Dapr graduated from the CNCF in October 2024, cementing its position as a leading solution for cloud-native microservices development.
This concept becomes clearer in the implementation section, but essentially Dapr provides your application code with unified APIs for service-to-service communication, abstracting away implementation details. Additionally, it automatically handles distributed tracing, circuit breaking, and retry/timeout logic - capabilities I’ve explored in my article on Service Mesh benefits, but delivered through a sidecar pattern rather than a traditional service mesh.
Dapr provides a comprehensive CLI tool similar to other Kubernetes ecosystem tools. Following the official Dapr installation guide, you’ll install the CLI first, initialize Dapr on your cluster, and then deploy the configuration resources.
Let me examine the Dapr configuration file in detail. Consistent with the infrastructure-as-code theme we’ve followed with eksctl, Dapr configuration is also defined in YAML files for clarity and maintainability.
This Dapr configuration defines enabled features and establishes OpenTelemetry integration for distributed tracing. The configuration uses the Datadog Agent service endpoint since the agent runs as a DaemonSet with one instance per node. This setup supports both HTTP and gRPC protocols for trace export, providing flexibility for different observability requirements.
apiVersion: dapr.io/v1alpha1
kind: Configuration
metadata:
  name: dapr-config
  namespace: dapr-services
spec:
  tracing:
    samplingRate: "1"
    otel:
      endpointAddress: "datadog-agent.datadog-operator.svc.cluster.local:4318"
      isSecure: false
      protocol: "http"
  features:
    - name: "ServiceInvocation"
      enabled: true
Let’s implement this distributed tracing setup by executing the commands below. The EBS CSI Driver is essential for providing the persistent storage that Dapr’s scheduler component requires for state management. Remember to install the Dapr CLI first if you haven’t already done so.
# Install EBS CSI driver addon
eksctl utils associate-iam-oidc-provider --region=us-west-2 --cluster=dapr-demo --approve
eksctl create addon --cluster dapr-demo --name aws-ebs-csi-driver --region us-west-2
# Set gp2 as default StorageClass
kubectl patch storageclass gp2 -p '{"metadata": {"annotations":{"storageclass.kubernetes.io/is-default-class":"true"}}}'

# Grab the CLI
curl -fsSL https://raw.githubusercontent.com/dapr/cli/master/install/install.sh | /bin/bash

# Initialize Dapr on cluster
dapr init -k

# Apply Dapr configuration
kubectl apply -f kubernetes/dapr/dapr-config.yaml
After a few moments, the dapr-system namespace contains all components necessary for Dapr microservices operation. Notice the various Dapr control plane components including the Operator, Dashboard, Sidecar Injector, and Scheduler - each playing a crucial role in distributed application runtime management.
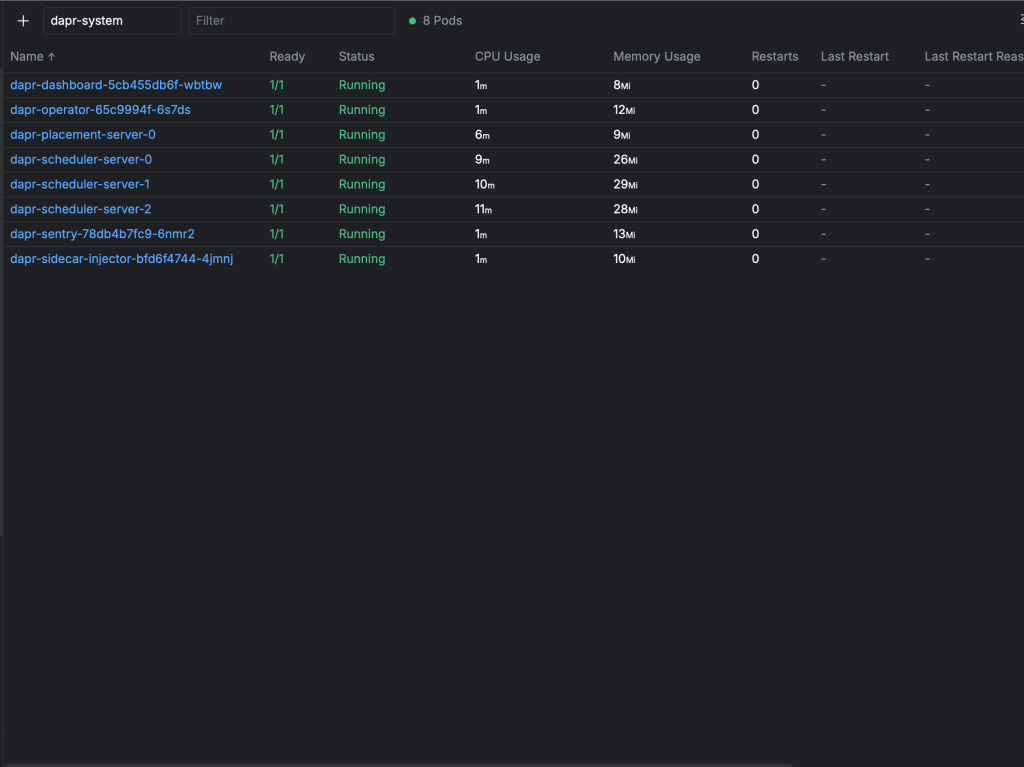
Dapr system components successfully deployed in the dapr-system namespace, providing distributed application runtime capabilities
Building Production Microservices with NestJS and Dapr
Now for the exciting part - implementing production-ready microservices! I’m shifting from infrastructure setup to application development, choosing TypeScript with NestJS to explore the Node.js Dapr SDK capabilities. NestJS provides an excellent foundation for building scalable microservices with built-in dependency injection, decorators, and enterprise patterns.
This technology choice demonstrates Dapr’s language-agnostic nature - while I typically work with Rust, Dapr seamlessly supports any programming language through its sidecar architecture and HTTP/gRPC APIs.
This microservices implementation demonstrates several powerful patterns:
- 2 containerized NestJS services optimized for Kubernetes deployment
- A Comms service that handles incoming requests and orchestrates calls to the Greeter service
- Service-to-service communication through the Dapr SDK - showcasing the ports and adapters (hexagonal architecture) pattern
- Automatic distributed tracing via OpenTelemetry that flows to Datadog without requiring OTel dependencies in application code
- Zero-code observability - traces are automatically generated and propagated by the Dapr sidecar
This architecture delivers enterprise-grade microservices observability with minimal developer overhead!
Deploying Microservices to Kubernetes
Following Kubernetes best practices, I’ll organize our microservices using dedicated namespaces for logical separation and resource management.
kubectl apply -f kubernetes/namespaces/dapr-services-namespace.yamlNext, I’ll deploy the microservice configurations. Before execution, let’s examine the Kubernetes manifests that enable Dapr sidecar injection and distributed tracing.
Key elements to observe are the Dapr annotations that enable sidecar injection and configure distributed tracing. The env section contains essential Dapr configuration parameters for service discovery and communication. These annotations transform standard Kubernetes deployments into Dapr-enabled microservices with automatic observability capabilities.
apiVersion: apps/v1
kind: Deployment
metadata:
  name: comms
  namespace: dapr-services
  labels:
    app: comms
spec:
  replicas: 1
  selector:
    matchLabels:
      app: comms
  template:
    metadata:
      labels:
        app: comms
      annotations:
        dapr.io/enabled: "true"
        dapr.io/app-id: "comms"
        dapr.io/app-port: "8080"
        dapr.io/config: "dapr-config"
    spec:
      containers:
      - name: comms
        image: public.ecr.aws/f8u4w2p3/node/comms:v3
        ports:
        - containerPort: 8080
        env:
        - name: HOST_IP
          valueFrom:
            fieldRef:
              fieldPath: status.hostIP
        - name: DAPR_HTTP_PORT
          value: "3500"
        - name: DAPR_HTTP_HOST
          value: "localhost"
        - name: SERVICE_NAME
          value: "comms"
        - name: ENVIRONMENT
          value: "demo"
        resources:
          requests:
            memory: "64Mi"
            cpu: "50m"
          limits:
            memory: "128Mi"
            cpu: "100m"
        readinessProbe:
          httpGet:
            path: /health
            port: 8080
          initialDelaySeconds: 5
          periodSeconds: 10
        livenessProbe:
          httpGet:
            path: /health
            port: 8080
          initialDelaySeconds: 15
          periodSeconds: 20
---
apiVersion: v1
kind: Service
metadata:
  name: comms-service
  namespace: dapr-services
spec:
  selector:
    app: comms
  ports:
  - protocol: TCP
    port: 80
    targetPort: 8080
  type: ClusterIP
Let’s deploy these production-ready microservices:
kubectl apply -f kubernetes/services/greeter-service.yaml
kubectl apply -f kubernetes/services/comms-service.yaml
Excellent! Our Dapr microservices are now running successfully:
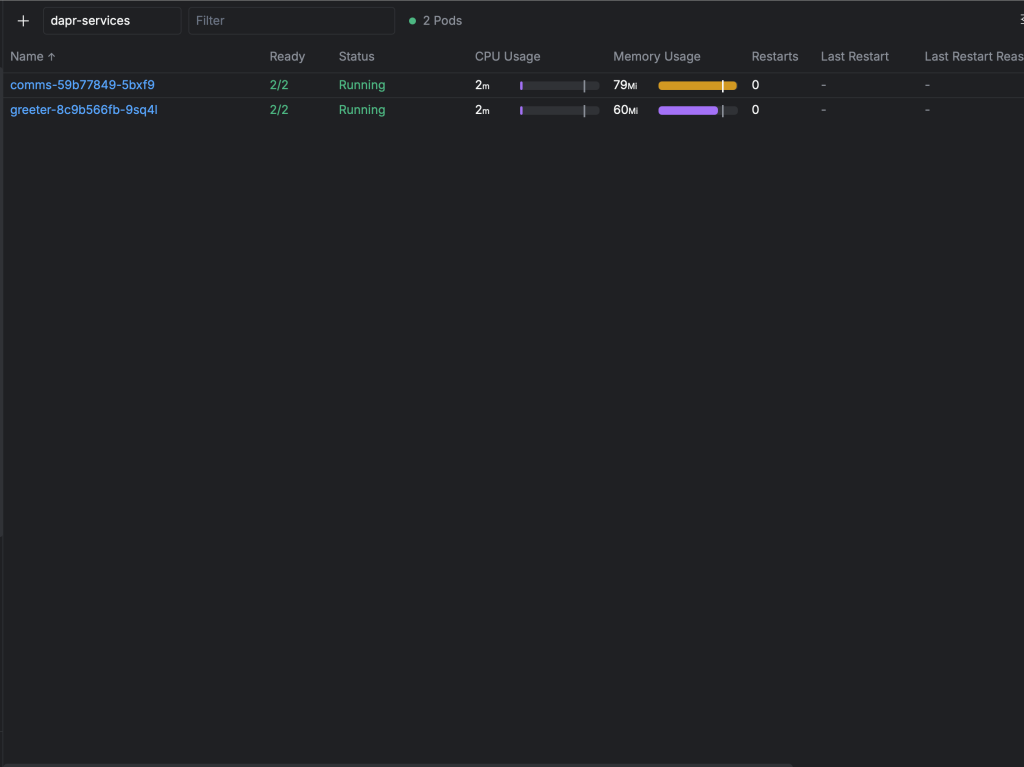
Each pod contains both the NestJS application container and the Dapr sidecar, enabling distributed communication and automatic tracing
Deep Dive: NestJS Microservices with Dapr SDK
Since both the Comms and Greeter microservices follow similar patterns, I’ll focus on the Comms service implementation to demonstrate Dapr SDK integration and distributed tracing capabilities.
The Comms service showcases clean microservices architecture with minimal dependencies. Notice the streamlined package.json with only essential NestJS components and the Dapr SDK - demonstrating how Dapr abstracts away the complexity typically associated with distributed systems communication.
"dependencies": {
    "@nestjs/common": "^10.0.0",
    "@nestjs/core": "^10.0.0",
    "@nestjs/platform-express": "^10.0.0",
    "@dapr/dapr": "^3.4.0",
    "reflect-metadata": "^0.1.13",
    "rxjs": "^7.8.1"
}
While this guide focuses primarily on Dapr distributed tracing rather than NestJS specifics, let’s examine the controller implementation that demonstrates service-to-service communication through the Dapr SDK.
When handling POST requests to the Comms service, the implementation showcases automatic trace propagation and error handling patterns:
  @Post('greet')
  async greet(@Body() greetRequest: GreetRequest) {
    console.log(`📝 Processing greet request for: ${greetRequest.name}`);

    try {
      // Dapr Client handles W3C trace context propagation automatically
      const response = await this.greeterService.callGreeterService(greetRequest.name);
      console.log(`✅ Successfully processed greeting for: ${greetRequest.name}`);
      return response;
    } catch (error) {
      console.error(`❌ Failed to process greeting for ${greetRequest.name}:`, error.message);

      // Return fallback response
      return {
        message: `Hello, ${greetRequest.name} (from fallback)!`,
        service: 'nestjs-comms',
        error: 'greeter_service_unavailable'
      };
    }
  }
The critical component is the greeterService.callGreeterService function call, which demonstrates Dapr SDK integration. The GreeterService constructor shows Dapr Client initialization - the foundation for distributed communication and automatic trace context propagation.
  constructor() {
    // Initialize Dapr Client - it will automatically use the correct Dapr sidecar
    this.daprClient = new DaprClient({
      daprHost: process.env.DAPR_HTTP_HOST || 'localhost',
      daprPort: process.env.DAPR_HTTP_PORT || '3500',
    });

    console.log('🔗 Dapr Client initialized');
  }
With the Dapr Client, service-to-service communication becomes remarkably simple. Dapr abstracts away networking complexities, service discovery, retries, timeouts, and circuit breaking - all the challenging aspects of distributed systems communication. This is achieved through the service annotations we configured earlier combined with the Dapr SDK.
Future articles will explore extending this pattern to integrate with message queues like AWS SQS, demonstrating the ports and adapters architecture that makes microservices truly adaptable. This aligns with concepts I’ve covered in my KEDA scaling articles, where we can combine Dapr’s abstraction with event-driven autoscaling.
const requestBody = { name };

// Use Dapr Client for service invocation
// This automatically handles W3C trace context propagation
const response = await this.daprClient.invoker.invoke(
  "greeter", // App ID of the target service
  "greet", // Method name
  HttpMethod.POST, // HTTP method
  requestBody // Request body
);
Load Testing and Distributed Tracing Validation
For distributed tracing demonstration purposes, I’ll use port forwarding instead of configuring an ingress controller. This approach allows us to focus on trace generation and observability patterns without additional networking complexity.
kubectl port-forward -n dapr-services svc/comms-service 8080:80Now let’s generate distributed trace data with concurrent requests:
seq 1 100 | xargs -n1 -P10 -I{} sh -c 'curl -s
    --location "http://localhost:8080/greet"
    --header "Content-Type: application/json"
    --data "{"name": "Benjamen{}"}" | json_pp;
    echo "--- Request {} ---"'
Perfect! Our Dapr microservices are now processing requests and automatically generating distributed traces via OpenTelemetry that flow seamlessly to Datadog APM. Let’s explore the observability insights this provides!
Comprehensive Observability: Dapr Dashboard and Datadog APM Analysis
Let’s explore the powerful observability capabilities that our Dapr microservices architecture provides. I’ll showcase both the Dapr Dashboard for service management and Datadog APM for comprehensive distributed tracing analysis.
Dapr Dashboard: Service Management and Monitoring
I’ve accessed the Dapr Dashboard via port forwarding from the cluster. In production environments, you’d typically expose this through an ingress controller with proper authentication and RBAC controls.
Dapr Services Overview
The Dapr Dashboard overview displays all registered microservices in our cluster, providing a comprehensive view of the distributed application topology.
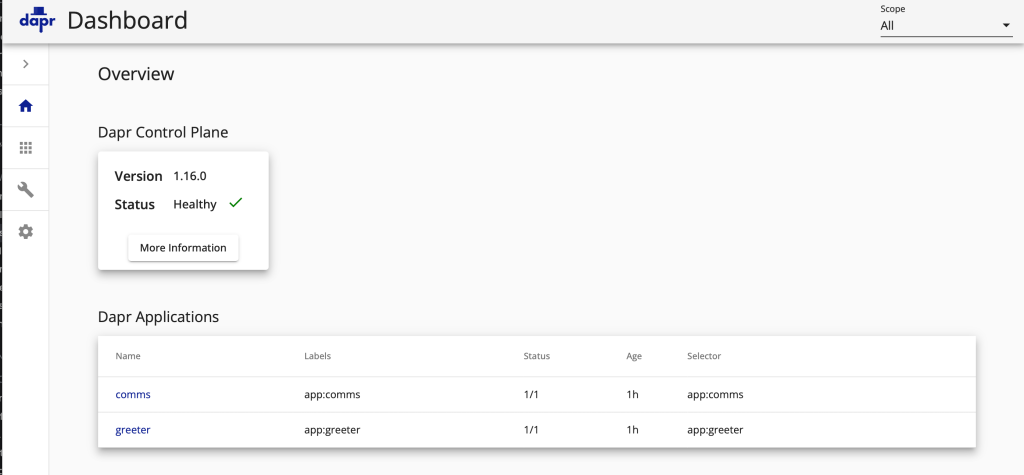
Dapr Dashboard overview displaying the comms and greeter microservices with their current status and configuration
Individual Service Monitoring
Each microservice provides detailed monitoring capabilities through multiple dashboard tabs, as demonstrated by this Comms Service summary showing service health, configuration, and performance metrics.
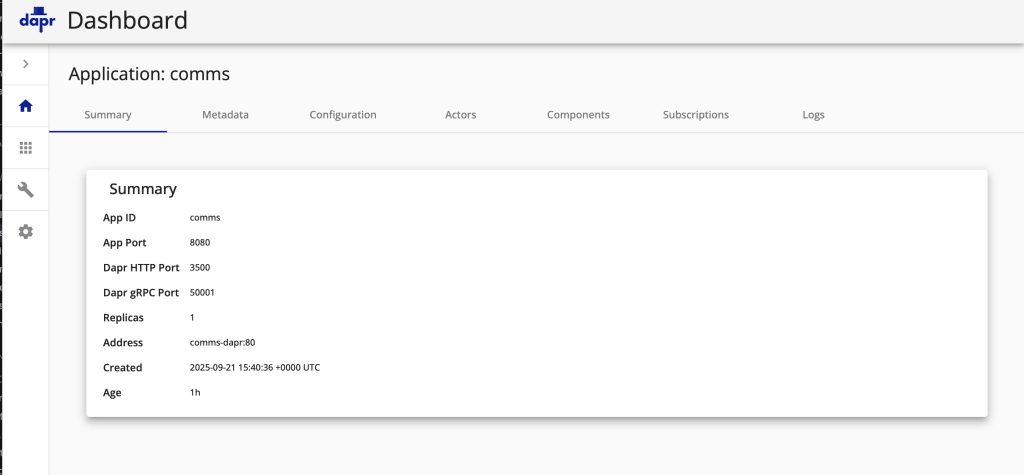
Detailed Dapr service summary for the Comms microservice, displaying health status, configuration, and operational metrics
Datadog APM: Enterprise-Grade Service Monitoring
The Datadog APM Services view provides enterprise-grade monitoring that complements the Dapr Dashboard. Notice how our microservices appear automatically in Datadog through the OpenTelemetry integration, providing comprehensive application performance monitoring capabilities.
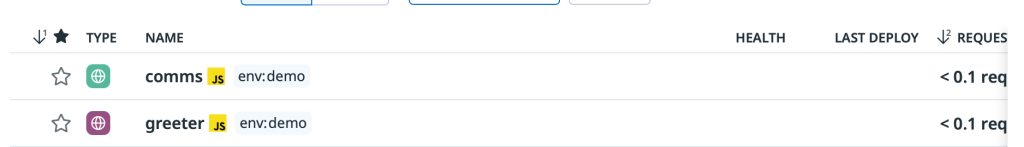
Datadog APM automatically discovers and monitors our Dapr-enabled microservices, providing comprehensive performance insights
Distributed Trace Performance Analysis
The stacked area chart provides exceptional visibility into trace performance distribution. Each Comms Service trace clearly shows the complete request flow: initial handler processing, Dapr service invocation to the Greeter service, and the Greeter handler execution timing. This distributed tracing visualization is invaluable for identifying performance bottlenecks in microservices architectures.
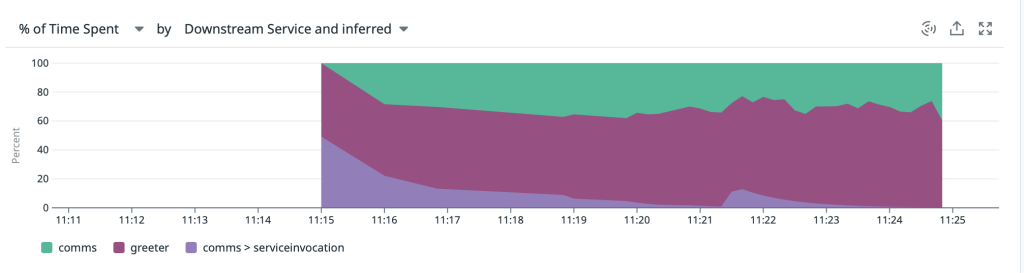
Detailed performance breakdown of distributed traces showing time spent in each microservice component and service invocation
Individual Trace Investigation
The Datadog trace list provides comprehensive visibility into every distributed trace flowing through our microservices. This enables detailed performance analysis, error investigation, and service dependency mapping.
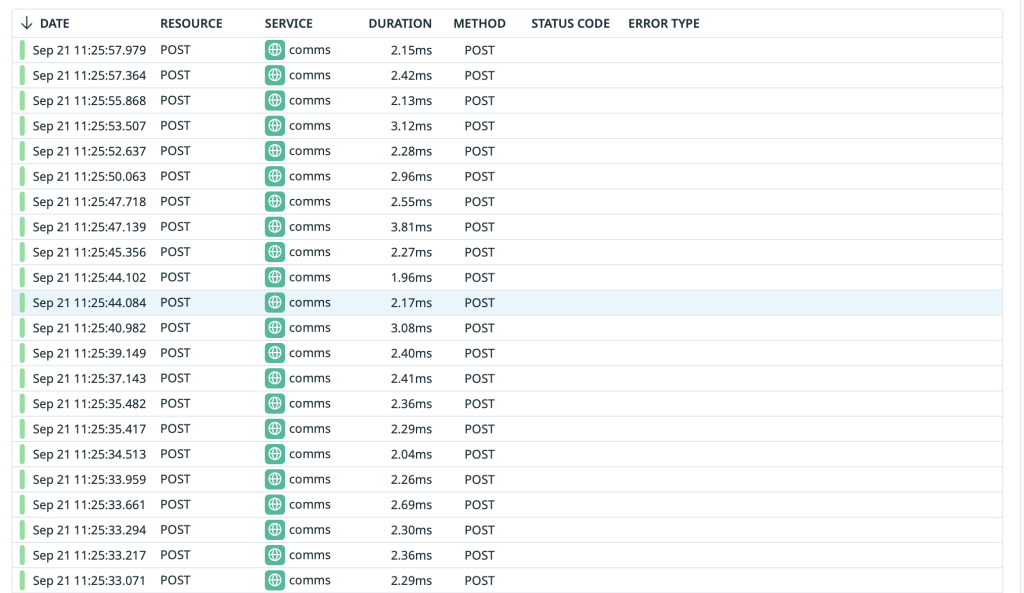
Complete trace list displaying all requests with status codes, response times, and service interaction patterns
Deep Trace Analysis: Spans and Performance Insights
Datadog offers multiple visualization options for deep trace analysis. Both Flame Graph and Span List views provide detailed insights into individual trace spans, enabling precise performance optimization and bottleneck identification in your distributed microservices.
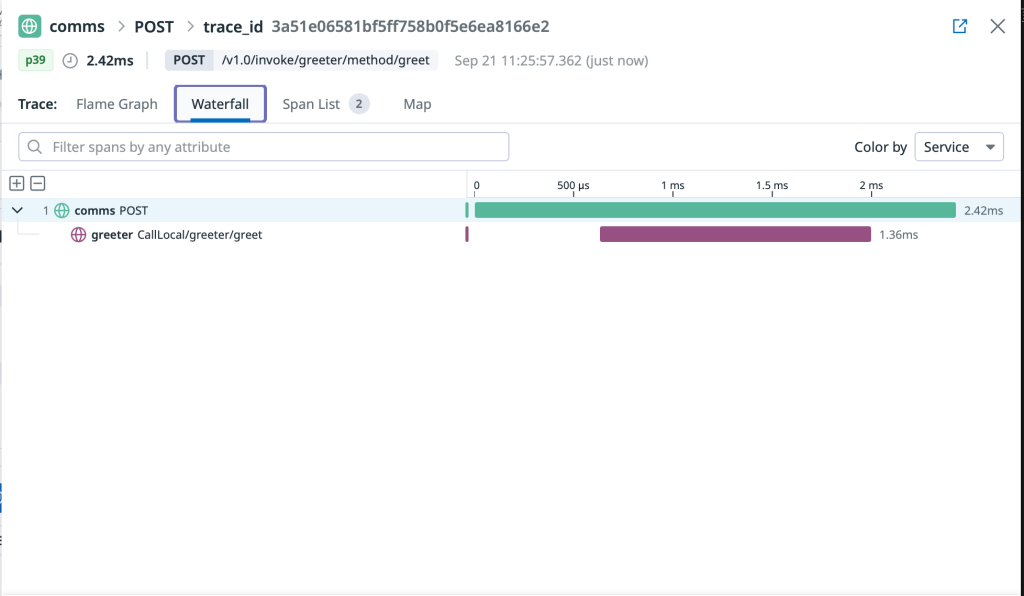
Flame graph visualization displaying hierarchical span relationships and precise timing for distributed trace analysis
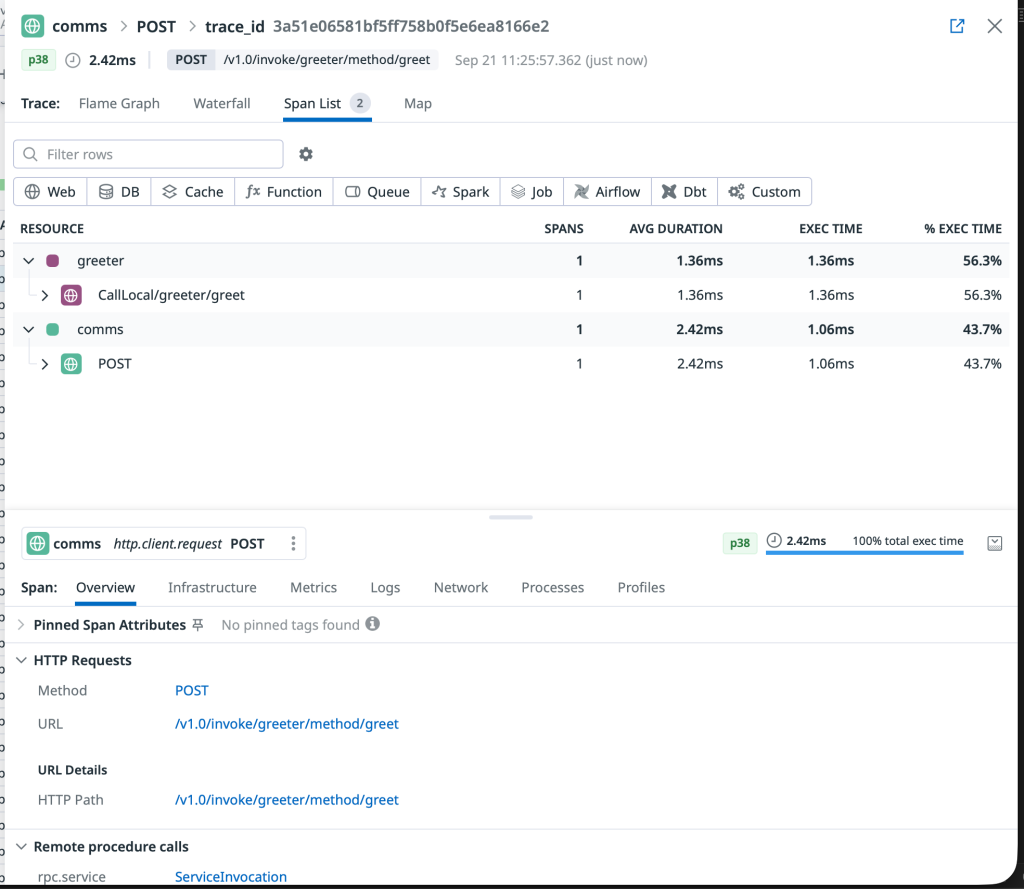
Comprehensive span list view providing detailed timing, metadata, and service interaction information for trace analysis
Dapr-Generated Observability Insights
This final visualization highlights the automatic observability that Dapr adds to our microservices. Notice how Dapr-specific spans appear in our traces, showing the sidecar’s role in service invocation, load balancing, and circuit breaking - all without requiring any observability code in our applications.
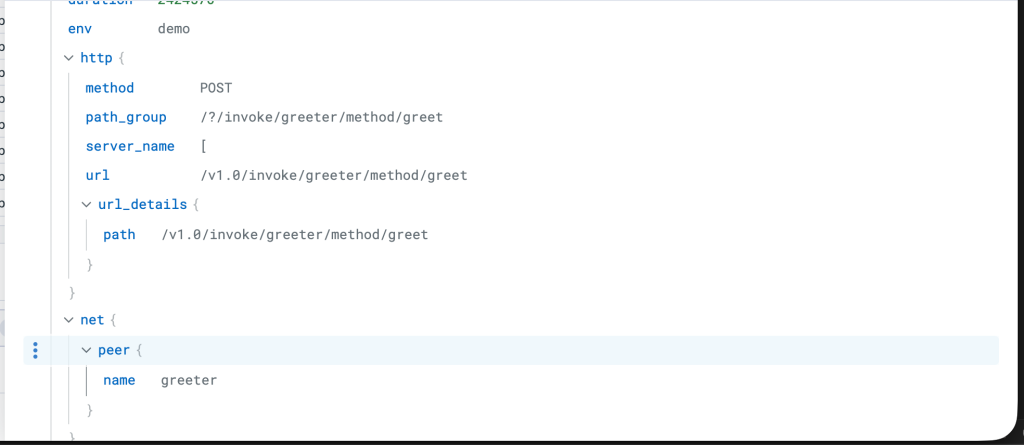
Detailed span information showing how Dapr automatically enriches traces with service invocation metadata and performance metrics
Expert Insights and Advanced Microservices Patterns
Building this comprehensive Dapr microservices solution has reinforced my conviction that Dapr represents the future of distributed application development. The framework excellently isolates business logic while providing extensible ports and adapters for integrating with diverse external systems.
This implementation demonstrates Dapr functioning as an intelligent service mesh, handling service discovery, communication patterns, and automatic observability without requiring traditional service mesh complexity.
Future Advanced Patterns
My next exploration will focus on event-driven microservices using Dapr Pub/Sub with AWS SQS, combined with KEDA autoscaling. This pattern would deliver:
- Message queue abstraction through Dapr’s pub/sub components
- Dynamic scaling based on queue depth via KEDA
- Vendor-agnostic messaging with easy queue implementation swapping
- Zero-code observability for async message processing
This builds upon patterns I’ve explored in my KEDA scaling articles, creating truly cloud-native microservices architectures.
Key Takeaways: Mastering Modern Microservices Architecture
Congratulations on completing this comprehensive guide to Dapr microservices on Kubernetes! You’ve mastered:
- Production-ready EKS cluster setup with optimal configurations
- Enterprise observability with Datadog and OpenTelemetry integration
- Dapr microservices patterns with automatic distributed tracing
- Zero-code observability implementation across service boundaries
- Ports and adapters architecture for truly adaptable systems
Integrating Dapr into your Kubernetes deployments unlocks unprecedented adaptability and observability for modern distributed applications. This foundation enables you to build scalable, resilient microservices that adapt to changing business requirements.
Resource Management
For cost optimization, use the included delete-all.sh script to clean up AWS resources when not actively using the cluster. This prevents unnecessary charges for EKS control plane and EC2 node usage.
Ready to take your microservices to the next level? Explore my related articles on Kubernetes observability and service mesh architectures for deeper insights.
Thanks for reading and happy building with Dapr and Kubernetes!